

Why use DevTools?
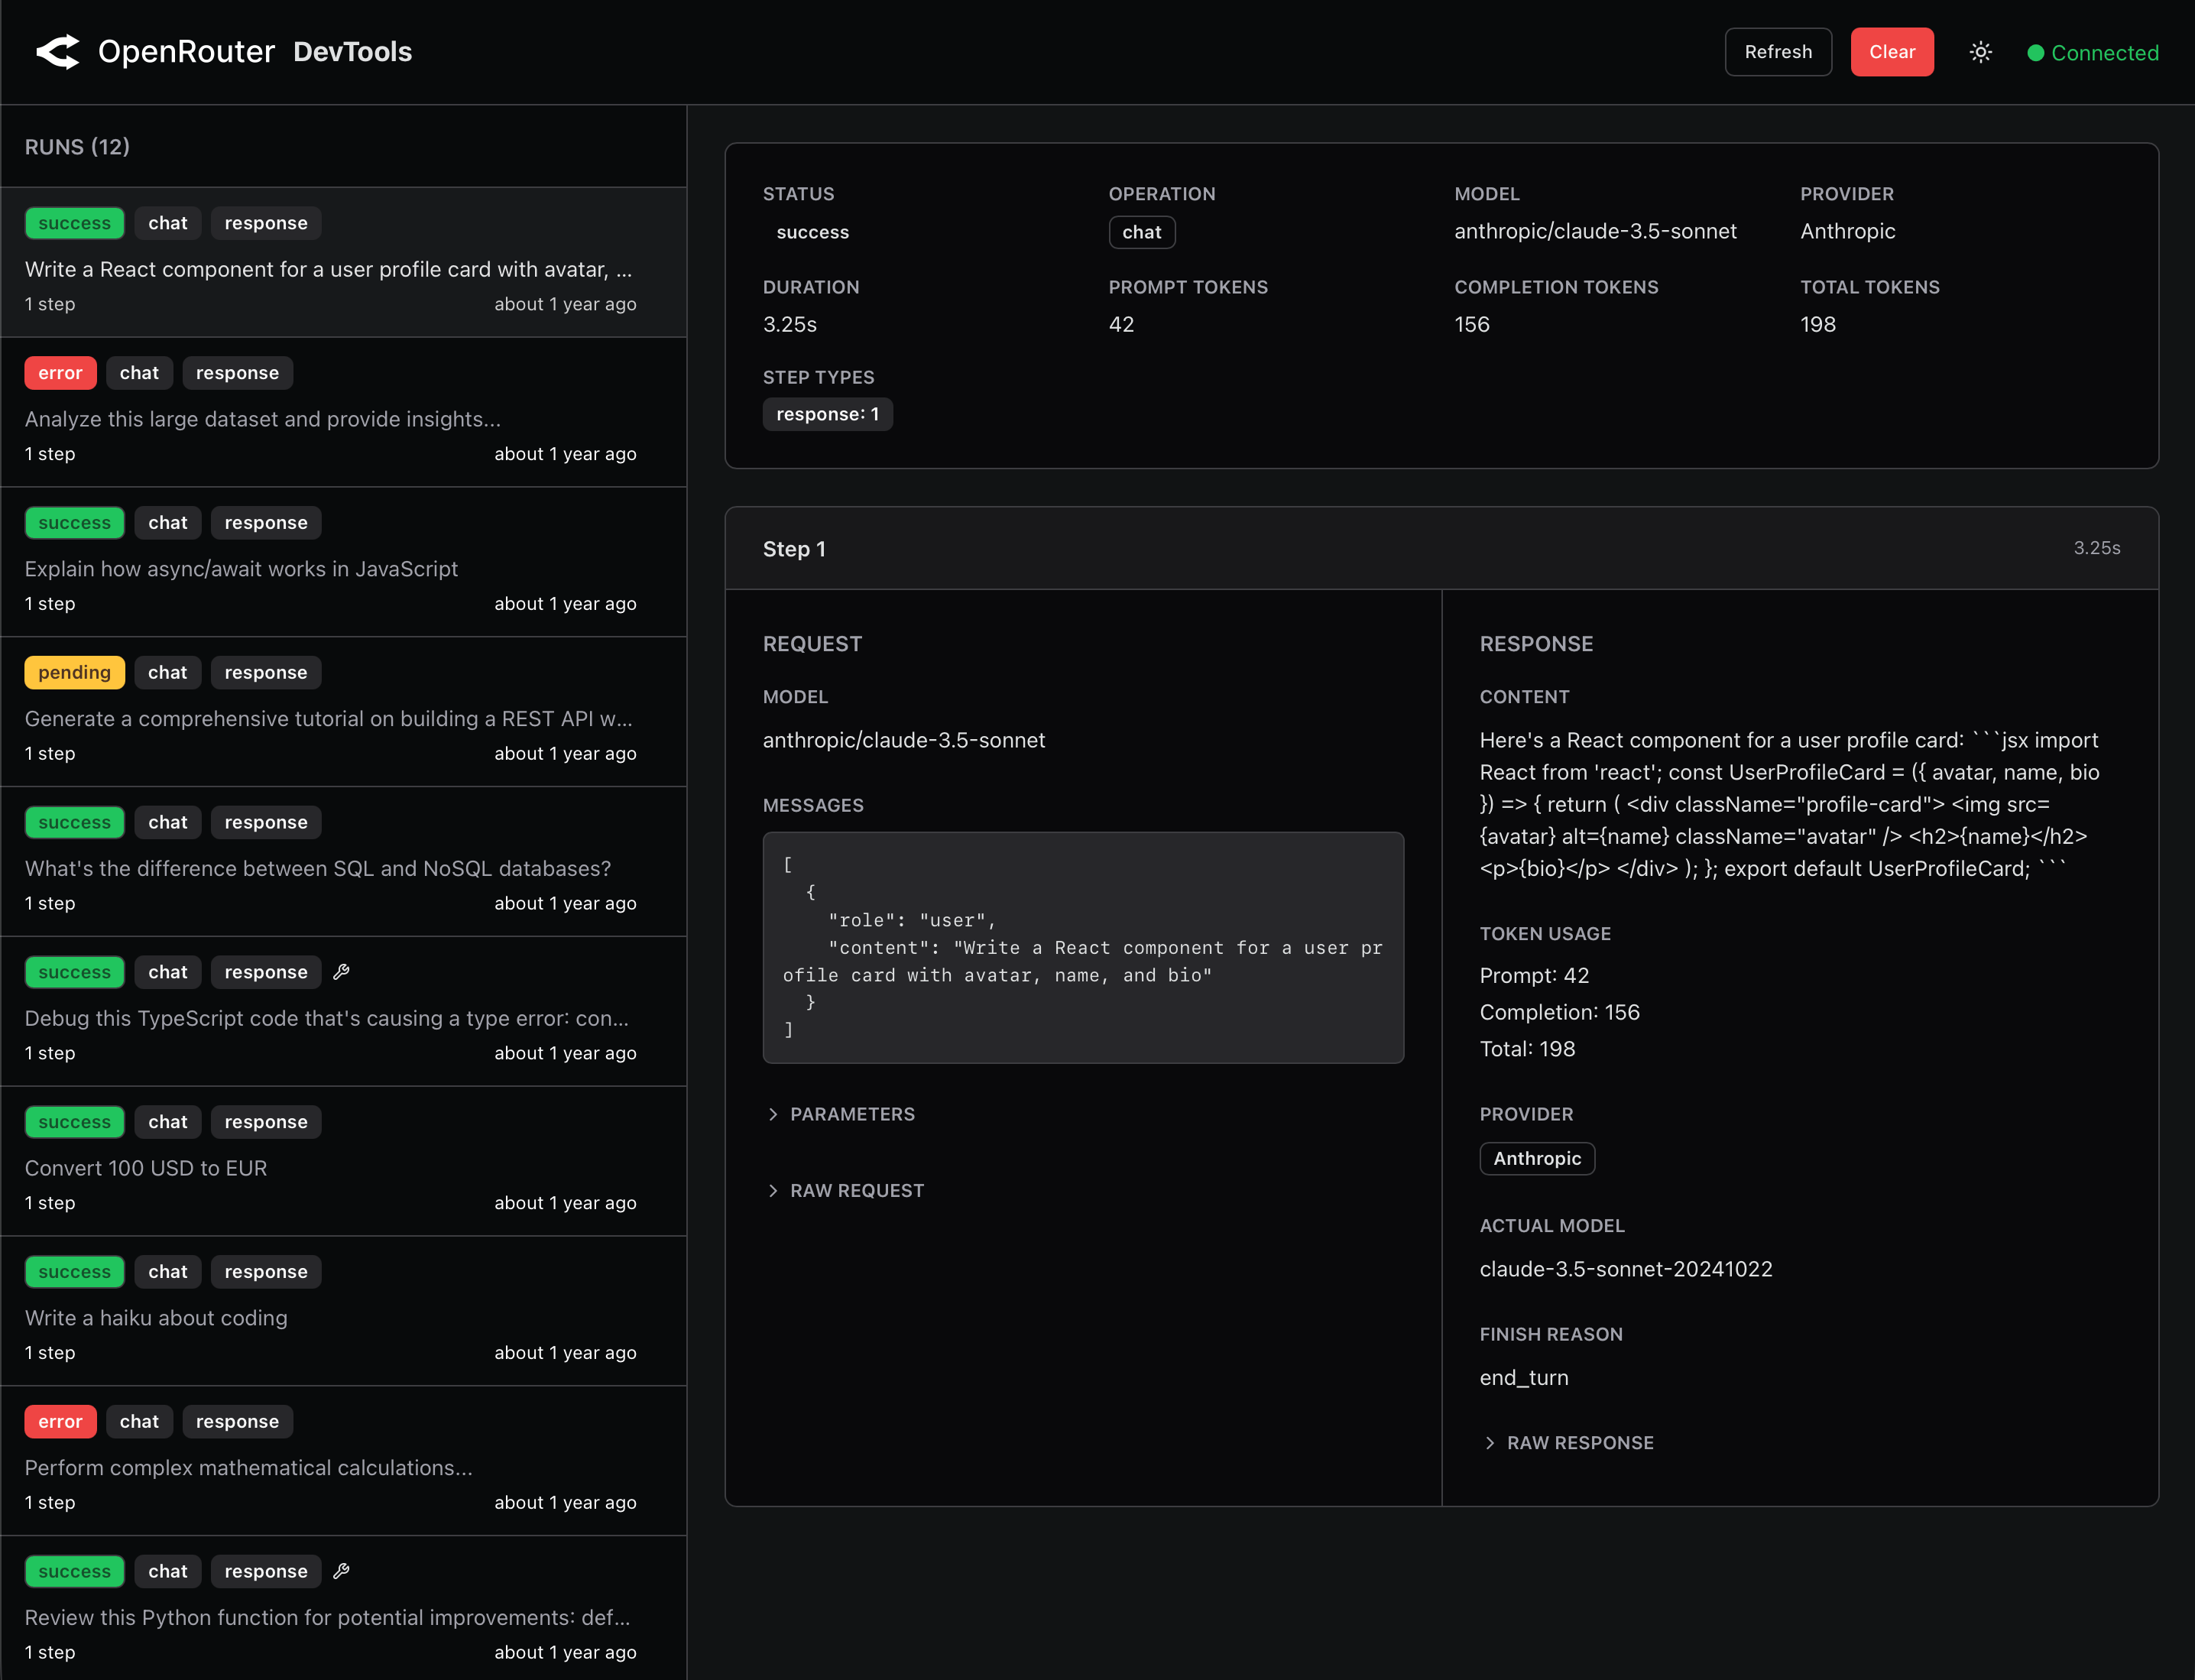
Building with AI SDKs requires visibility into what’s happening under the hood. The DevTools viewer helps inspect telemetry produced by a compatible integration. Two main components:- SDK Telemetry Hooks - Normalize supported operations into the DevTools telemetry format
- DevTools Viewer - Beautiful web UI for visualizing captured telemetry data
Key Features
SDK DevTools Viewer
Launch a web-based interface to visualize your SDK telemetry:- Run tracking - View operations from an existing compatible telemetry file
- Detailed step analysis - Inspect request/response data, timing, and errors for each step
- Token usage insights - Track prompt and completion tokens across all requests
- Error debugging - Easily identify and debug failed requests with full error details
- Dark/Light mode - Full theme support with automatic system preference detection
SDK Telemetry Hooks
For compatible operations that complete successfully, the hooks record:- Request and response data
- Token usage
- Timing information for performance analysis
- Errors and failure modes
- Model information
Installation
Install the DevTools package as a development dependency:openrouter devtools command:
NODE_ENV === 'production' to prevent accidental production deployment.
Client Compatibility
The generated@openrouter/sdk client is not an alternative setup: its typed public constructor options do not provide a way to attach the plain DevTools hook object. Neither published client currently provides a complete supported public integration.
Quick Start - DevTools Viewer
From a project containing an existing compatible.devtools/openrouter-generations.json file, launch the DevTools web interface:
http://localhost:4983 in your browser to view:
- All SDK runs with timestamps and status
- Step-by-step request/response details
- Token usage
- Error messages and stack traces
- Performance timing information
How It Works
Telemetry Capture Flow
With a compatible hook integration:- SDK hooks intercept requests before they’re sent
- Hook processing parses the request or response body
- Data is stored in
.devtools/openrouter-generations.json - A notification is sent to the local DevTools server (if running)
- The DevTools viewer updates in real-time
Failure Isolation
- Request preservation - Hooks return the original SDK request or response
- Graceful degradation - Capture errors are swallowed instead of replacing the SDK result
- Hook overhead - Body parsing runs inside the SDK hook lifecycle; capture is not zero-cost
- Development-only - Throws error if used in production (
NODE_ENV === 'production')
Storage Location
By default, telemetry is stored in:- Runs - Top-level tracking of SDK operations
- Steps - Individual request/response pairs within each run
- Metadata - Timestamps, status, token usage, errors
Configuration Options
Hook Configuration
When callingcreateOpenRouterDevtools(), you can customize:
DevTools Server Configuration
The DevTools viewer runs on port 4983 by default. SetOPENROUTER_DEVTOOLS_PORT when launching the CLI to use a different port:
Recognized Operation IDs
The hooks recognize these internal SDK operation IDs:createResponses- Responses API callssendChatCompletionRequest- Chat completions API calls
createResponses, but its streaming response is unsupported. The generated Client SDK reaches sendChatCompletionRequest, but it cannot attach the plain hooks through its typed public options. All other SDK operations, including embeddings, are ignored.
Data Captured Per Step
For each compatible operation that completes successfully, DevTools captures: Request Data:- Model name
- Messages/prompts
- Parameters (temperature, max_tokens, etc.)
- Generated content
- Token usage (prompt + completion tokens)
- Provider and model used
- Finish reason
- Start and completion timestamps
- Duration in milliseconds
- Status (success, error, in_progress)
- Error details (if failed)
Safety & Best Practices
Production Environment Protection
Creating DevTools hooks throws an error whenNODE_ENV === 'production'. Only initialize the package in a development environment and only from a compatible integration.
Capture Failure Isolation
- Hook body parsing is awaited by the SDK hook lifecycle
- DevTools capture errors do not replace your SDK result
- Failed writes are silently ignored and don’t break your application
Error Handling
DevTools catches failures in request parsing, response parsing, storage, and server notification. A capture failure can leave telemetry missing or incomplete, but it does not replace the SDK request or response.Troubleshooting
Port Already in Use
If port 4983 is already in use:Storage Location Issues
If you can’t find the telemetry file:- Check the default location:
.devtools/openrouter-generations.json - Ensure you have write permissions in your working directory
- Check for custom
storagePathconfiguration
DevTools Viewer Not Updating
If the viewer doesn’t show new requests:- Verify the DevTools server is running (
openrouter devtools) - Check that
serverUrlmatches the DevTools server port - Ensure the telemetry file is being written (check
.devtools/directory) - Try refreshing the browser manually
Common Setup Issues
Issue: DevTools package not foundIssue: Accidental production usage